
Hi,
Does anyone know how models/diagrams are created?
Kind Regards
Edward
Hi,
Does anyone know how models/diagrams are created?
Kind Regards
Edward
The diagrams within the GUI are SVG files that are generated with a JavaScript library. The Javascript is open source:
To render models correctly, the library requires charm authors to supply metadata. In particular, charms need to have an icon available and the x and y coordinates specified.
Thanks timClicks,
Do you know where I might find the JavaScript library? Really like the diagram generation and It would be great to use it in other projects much like the Vanilla Framework.
Kind Regards,
Edward
Oh, sorry! I thought it was linked in that page I shared. Here is the repository:
https://github.com/canonical-web-and-design/juju-cards
Here is the deep link to the compiled library itself:
https://assets.ubuntu.com/v1/juju-cards-v1.7.2.js
I believe the maintainer is @anthonydillon
Thanks timClicks. I’ll have a look at these links.
Regards,
Edward
I recently started working on a new topology rendering implementation for the new JAAS Dashboard. The JS can be found here: https://github.com/canonical-web-and-design/jaas-dashboard/blob/master/src/components/Topology/Topology.js It uses the positional annotations in the users model to position the various icons and then draw the relation lines between them.
If you’re looking for a system to generate a static svg from a bundle with positional arguments then you can take a look at this older project(golang): https://github.com/juju/jujusvg
The new topology in the JAAS Dashboard is still quite early in development and only supports full and subordinate applications as well as basic relation lines. I will at some point in the future add the ability to reposition the applications in your model. You can track that issue here: https://github.com/canonical-web-and-design/jaas-dashboard/issues/244.
If you wouldn’t mind elaborating on how you plan to use these visualizations maybe I can provide some feedback or help.
Hi hatch,
Thanks for the response. I’m new to this discourse and unsure whether this place is meant for discussions about Canonical products or whether non Canonical discussion can be had.
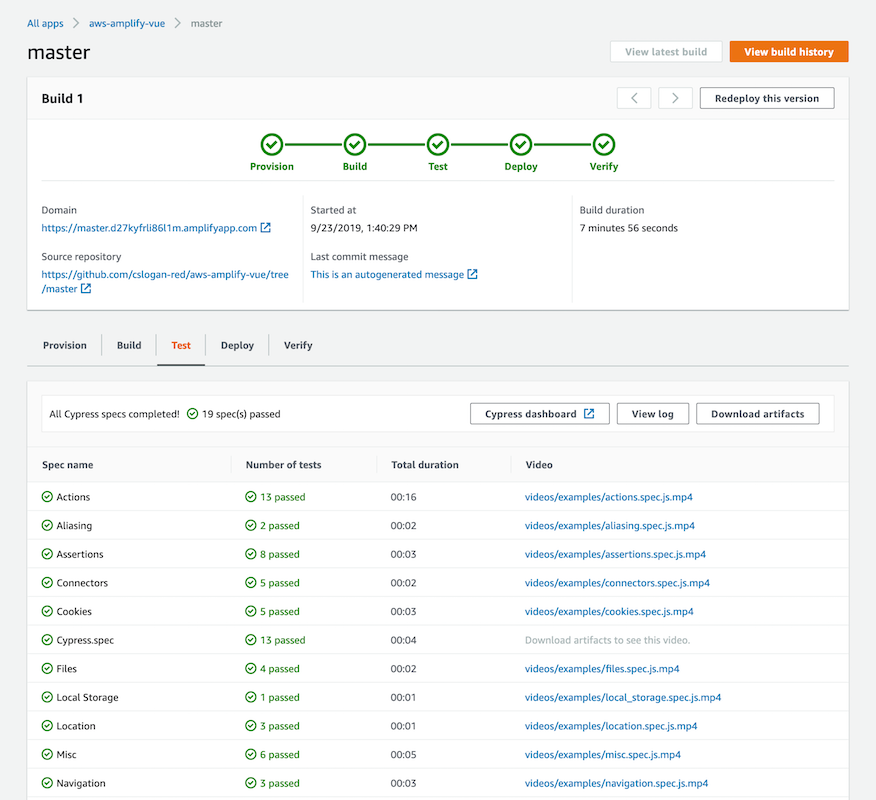
I’m looking to build a flow diagram similar to the way AWS Amplify illustrates its build process using green circles with a check mark inside. ( see link )
https://user-images.githubusercontent.com/1362558/66039354-ee33f580-e514-11e9-8db1-34ac6fc13e7e.png
The flow diagram is to eventually form part of a dashboard.
Given the Vanilla framework is open for use, I figured I’d ask about the juju charm objects in these typologies or how they are generated as I really like the way its being represented here https://jujucharms.com/
Initially the idea was to design them in d3js however if these juju charm renderings can be used elsewhere, it would be awesome 
Kind Regards,
Edward
Ahh, so what you’re looking for is just the svg icon generation. It’s actually a pretty simple SVG that gets generated, the d3 code that generates it is here: https://github.com/canonical-web-and-design/jaas-dashboard/blob/master/src/components/Topology/Topology.js#L170-L230
The actual generated markup is simply:
<g transform="translate(2, 319)" class="application" data-name="kibana">
  <circle cx="90" cy="90" r="90" fill="#f5f5f5" stroke-width="3" stroke="#888888"></circle>
  <image xlink:href="https://api.jujucharms.com/charmstore/v5/trusty/kibana-14/icon.svg" width="126" height="126" transform="translate(28, 28)" clip-path="circle(55px at 63px 63px)"></image>
</g>